Research Portfolio · Satellite Hydrometeorology
Rainfall-Triggered Landslides
The satellite-precipitation research program of
Prof. Yang Hong — and the field it launched
HyDROS Lab · School of Civil Engineering & Environmental Science
University of Oklahoma · (formerly NASA Goddard Space Flight Center)
The Big Idea
Predicting landslides from space
Most fatal landslides are triggered by intense or prolonged rainfall. Hong's insight: both ingredients needed to forecast them globally can be sensed from orbit.
① Where — Susceptibility
A static map of predisposition: slope, soil type & texture, elevation, drainage, land cover.
② When — The Trigger
Near-real-time satellite rainfall (TRMM → IMERG) tested against intensity–duration thresholds.

The modern realization of idea ①: global landslide susceptibility. Figure: Stanley & Kirschbaum (2017), Natural Hazards — built on the framework Hong et al. (2007) introduced.
The Research Arc
From concept to operational system
- 2006Proof of concept — satellite rainfall can flag global landslide hazard (GRL)
- 2007Global susceptibility map, prediction system & the Eos vision paper (Nat. Hazards; IEEE TGRS; Eos)
- 2008Spatiotemporal prediction — where and when, globally (IJSR)
- 2009–10Validation & catalogs — algorithm tested against a global inventory (NHESS; Nat. Hazards)
- 2010–11Physically-based models — SLIDE (Indonesia) & TRIGRS (hurricanes) (Landslides; Nat. Hazards)
- 2012–16Nowcasting, regionalization, coupling — China map; iCRESTRIGRS flood–landslide (Env. Earth Sci.; HESS)
- 2017–25The field scales up — LHASA 1.0/2.0, global forecasting, climate projections (others, building on this base)
Hong's foundational work
Thirteen papers in which Yang Hong is an author — establishing that a global, satellite-driven landslide hazard system was possible, then building and validating one.
The foundational paper. Showed NASA's TRMM Multi-satellite Precipitation Analysis (TMPA) can be combined with a global susceptibility map to assess landslide hazard in near-real-time, globally.
Why it matters: Launched the entire satellite-precipitation landslide research program.

Annual and conditional daily rainfall from 8-year TRMM data.
Figure: Hong et al. (2006), Geophys. Res. Lett.
The Trigger, Quantified
Rainfall intensity–duration thresholds
A landslide fires when rainfall intensity sustained over a duration crosses an empirical threshold. Hong et al. showed satellite rainfall reproduces the classic ground-based curves (Caine 1980) worldwide — the key test that made a global system credible.
The insight: An I–D threshold turns a rainfall field into a yes/no trigger on every grid cell on Earth — no rain gauges required.

TMPA-derived I–D threshold vs. the Caine worldwide curve, plus landslide occurrences.
Figure: Hong et al. (2006), Geophys. Res. Lett.
Built the first global landslide susceptibility map, combining six factors — slope/DEM, soil type, soil texture, elevation, drainage density, land cover — via a weighted heuristic approach. Flagged major hotspots in the Andes, Himalaya, and eastern Brazil.
Why it matters: This map became the static "where" layer for every later global landslide hazard and early-warning system — including NASA's operational LHASA.
The community-facing statement of the programme: combining (1) DEM, satellite land cover and soil maps with (2) high-time-resolution multi-satellite precipitation gives information on both the "where" (susceptibility) and the "when" (rain events) of landslides.
Why it matters: Put the satellite-based landslide-monitoring agenda in front of the whole AGU readership — the paper that recruited the field.
Coupled the susceptibility map with real-time TRMM rainfall and empirical intensity–duration thresholds into an experimental system flagging where and when rainfall may trigger landslides — the first fully satellite-driven global prediction framework.
Why it matters: The key architecture paper for global landslide nowcasting.
A conceptual three-component early-warning framework: (1) a susceptibility database, (2) a real-time spaceborne precipitation system, and (3) near-real-time ground-shaking prediction for earthquake triggers.
Why it matters: Set the roadmap for multi-hazard, satellite-based global landslide warning.
Integrated susceptibility zoning with real-time TRMM rainfall to predict both where and when landslides are likely worldwide — advancing from static hazard maps to dynamic spatiotemporal prediction.
Why it matters: The step from "hazard assessment" to genuine "prediction."
The first rigorous validation of the Hong et al. global algorithm — quantifying detection skill and false-alarm rates. Good event capture, but notable regional performance variability.
Why it matters: Turned a promising idea into a measurable, improvable system.

Global susceptibility index (0–5) with 2003 and 2007 observed landslides overlaid.
Figure: Kirschbaum et al. (2009), NHESS.
A global inventory of rainfall-triggered landslides (2003, 2007–2009) from news and government reports, to calibrate and validate satellite algorithms — with candid treatment of reporting bias.
Why it matters: The reference "ground truth" for validating global landslide models.

Reported landslide events, 2003 / 2007 / 2008.
Figure: Kirschbaum et al. (2010), Natural Hazards.
A regional prototype over Java, Indonesia, introducing the physically-based SLIDE model — a factor-of-safety scheme accounting for rainfall infiltration and partial soil saturation. Successfully reproduced observed landslide timing.
Why it matters: Introduced SLIDE and moved the programme from empirical thresholds toward physics.
Evaluated the USGS TRIGRS physically-based model for Hurricane Ivan (2004) landslides in the Blue Ridge Mountains, assessing spatiotemporal factor-of-safety mapping against observed slides.
Why it matters: Benchmarked a physics-based model for hurricane-driven landslide hazard in the U.S.
Compared global vs. regional configurations of the satellite-driven nowcasting approach. Regional tuning of thresholds and susceptibility clearly beat a one-size-fits-all global model.
Why it matters: Established that regionalization is essential for operational skill.

ROC curves — regional model (black) vs. the earlier global algorithm (blue), Central America.
Figure: Kirschbaum et al. (2012), Environ. Earth Sci.
A national susceptibility map for China integrating multi-source geospatial data via a weighted susceptibility-index approach, identifying the country's most landslide-prone regions.
Why it matters: Scaled the global methodology down to detailed national resolution.
Coupled the CREST distributed hydrologic model with TRIGRS slope stability, so simulated soil moisture drives landslide initiation — forecasting floods and landslides as one cascading hazard.
Why it matters: Unified Hong's two research lines — hydrologic modeling and landslide hazard — in a single system.
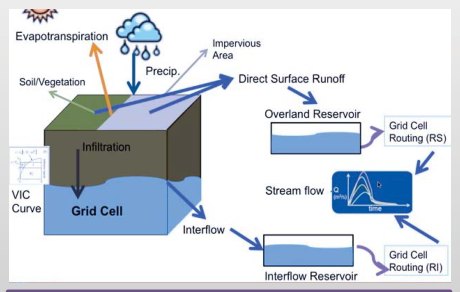
CREST grid-cell water balance: infiltration, overland & interflow reservoirs.
Figure: Zhang, Xue, Hong et al. (2016), HESS.
What the field built on it
These papers are by other groups — chiefly Kirschbaum, Stanley and colleagues at NASA Goddard. They are included because they are the direct descendants of the 2006–2008 framework, and they show where the idea ended up.
A refined global susceptibility map using fuzzy overlay of slope, geology, fault distance, forest loss and road networks — the direct successor to Hong et al. (2007), at higher resolution and with better validation.
Lineage: This is the susceptibility layer that now runs inside NASA's operational system.
Global landslide susceptibility, five classes.
Figure: Stanley & Kirschbaum (2017), Natural Hazards.
Replaced the fixed rainfall threshold with a machine-learning model (XGBoost) driven by antecedent rainfall, IMERG near-real-time precipitation and SMAP soil moisture — outputting a calibrated landslide probability rather than a binary flag.
The evolution: Hong's I–D threshold → a learned, soil-moisture-aware probability surface.

LHASA 2.0 dynamic inputs: antecedent rainfall, IMERG, SMAP soil moisture, snow mass.
Figure: Stanley et al. (2021), Front. Earth Sci.
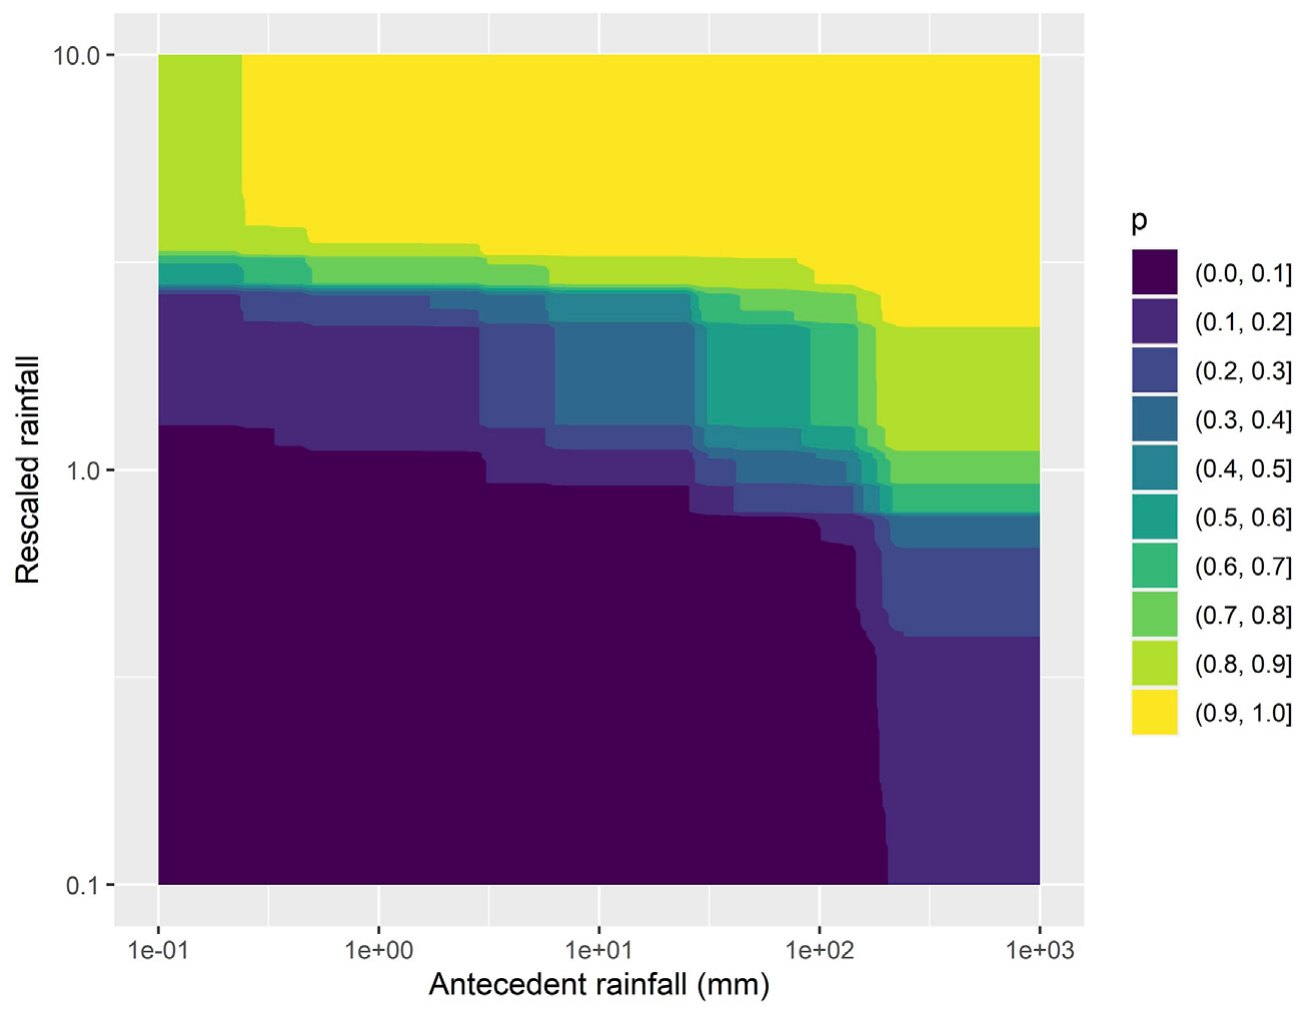
Learned probability surface over antecedent × current rainfall.
The Payoff
A real event, nowcast in near-real-time
Hurricane Iota, 18 November 2020. The operational global nowcast flagged moderate-to-high landslide hazard across Honduras and Nicaragua as the storm came ashore — exactly the situational-awareness product the 2007 Eos paper argued for.
Fourteen years from "this might be possible" (2006) to a running global service issuing hazard maps during a landfalling hurricane.

Figure: Stanley et al. (2021), Front. Earth Sci.
Moved from nowcast to forecast, driving the landslide model with GEOS precipitation forecasts so hazard can be anticipated days ahead instead of diagnosed after the rain falls.
The frontier: Anticipation, not just detection — and a mean-probability climatology of where landslides are most likely on any given day.

Mean landslide probability, with notable 2020 events annotated.
Figure: Kirschbaum et al. (2022), Front. Earth Sci.
Applied the satellite-trained landslide model to climate projections over High Mountain Asia, finding hazard rises ~15% (SSP2-4.5) to over 40% (SSP5-8.5) by 2100, concentrated along the Himalayan front.
The long arc: A framework built to see today's rain now projects next century's risk.

Landslide hazard indicator, High Mountain Asia.
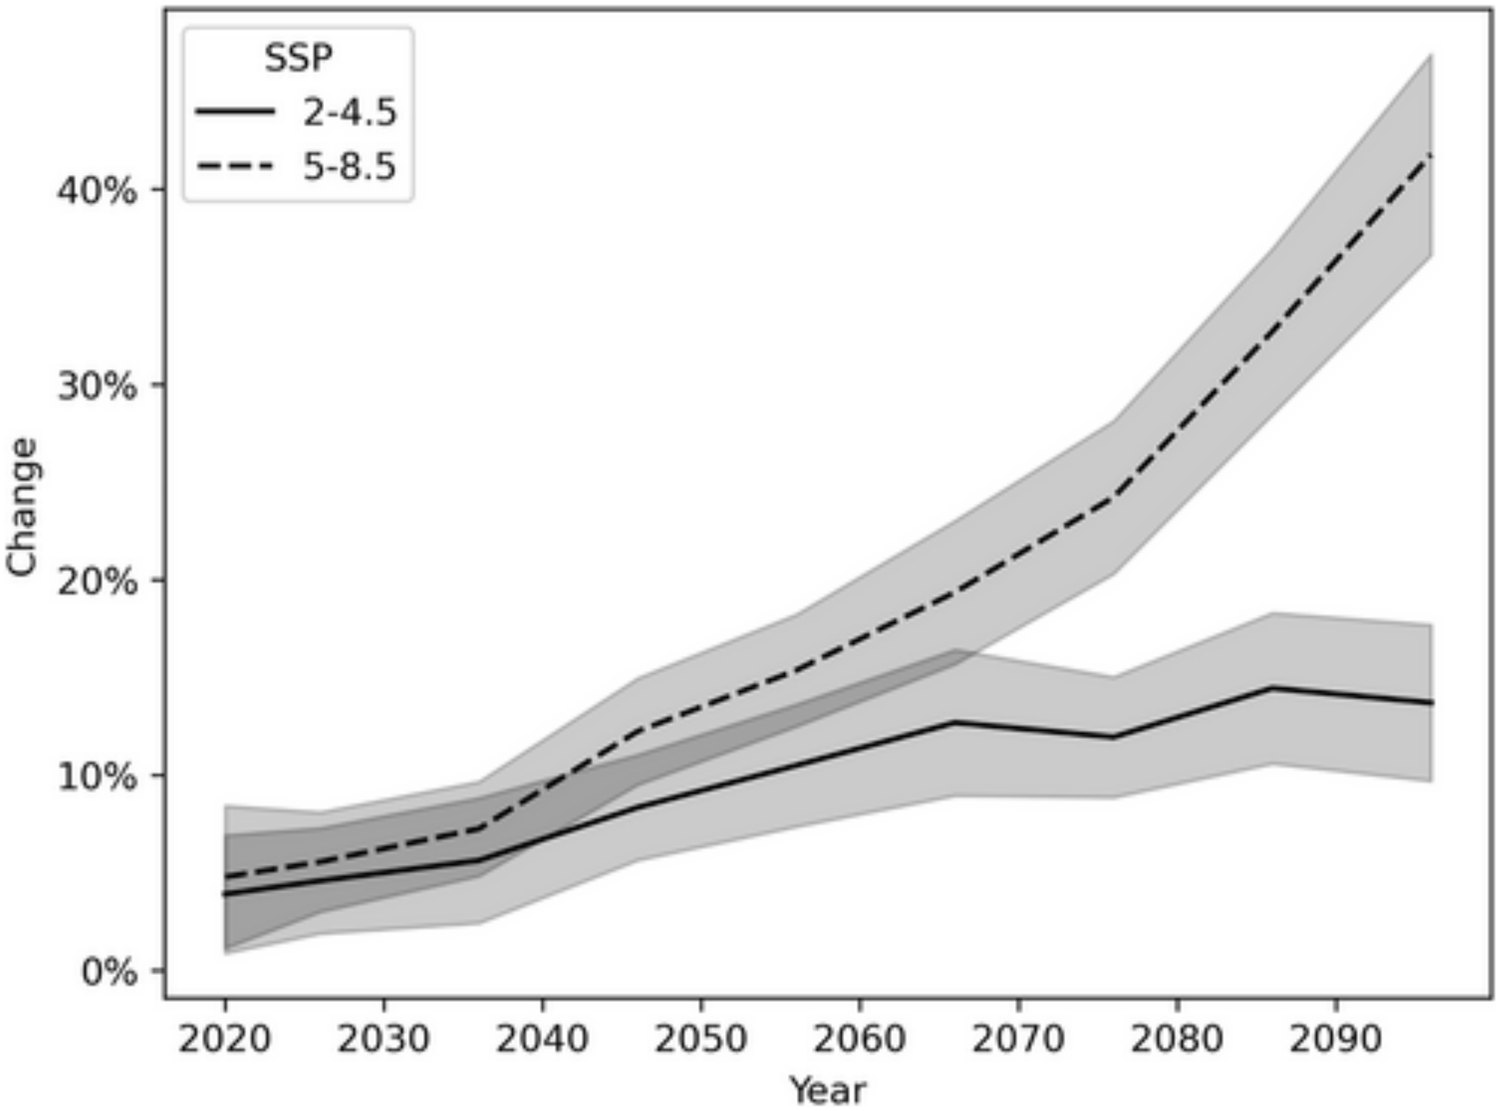
Projected change under SSP2-4.5 / SSP5-8.5. Figures: Stanley et al. (2025), Earth's Future.
The 2010 Global Landslide Catalog has grown into a family of open, browsable inventories (COOLR / NASA Landslide Viewer) with community reporting — the data infrastructure the whole field now validates against.
Closing the loop: Better inventories → better-trained models → better forecasts.

NASA Landslide Viewer / COOLR open landslide repository.
Figure: Vershel et al. (2025), Geosci. Data J.
Reading Across the Body of Work
Four threads
🛰️ Satellite-first
Global coverage from TRMM → IMERG rainfall plus remotely-sensed terrain — no dependence on sparse ground networks.
🗺️ Where × When
Static susceptibility fused with a dynamic rainfall trigger — the organizing equation of the whole field.
📉 Empirical → physical → learned
I–D thresholds → SLIDE/TRIGRS factor-of-safety → machine-learned probability with soil moisture.
✅ Validate & regionalize
Global catalogs enabled honest skill assessment; regional tuning proved necessary for real accuracy.
The 2006–2008 papers are the direct ancestor of NASA's operational LHASA global landslide nowcasting system — now running daily, forecasting days ahead, and projecting hazard to 2100.
References · Act I
Papers authored by Yang Hong
- Hong, Y., Adler, R., Huffman, G. (2006). Evaluation of the potential of NASA multi-satellite precipitation analysis in global landslide hazard assessment. Geophys. Res. Lett., 33, L22402. doi:10.1029/2006GL028010
- Hong, Y., Adler, R., Huffman, G. (2007). Use of satellite remote sensing data in the mapping of global landslide susceptibility. Natural Hazards, 43(2), 245–256. doi:10.1007/s11069-007-9104-7
- Hong, Y., Adler, R. F., Huffman, G. J. (2007). Satellite remote sensing for global landslide monitoring. Eos, Trans. AGU, 88(37), 357–358.
- Hong, Y., Adler, R. F., Huffman, G. (2007). An experimental global prediction system for rainfall-triggered landslides… IEEE TGRS, 45(6), 1671–1680. doi:10.1109/TGRS.2006.888436
- Hong, Y., Adler, R. (2007). Towards an early-warning system for global landslides triggered by rainfall and earthquake. Int. J. Remote Sensing, 28(16), 3713–3719. doi:10.1080/01431160701311242
- Hong, Y., Adler, R. F. (2008). Predicting global landslide spatiotemporal distribution… Int. J. Sediment Research, 23(3), 249–257. doi:10.1016/S1001-6279(08)60022-0
- Kirschbaum, D. B., Adler, R., Hong, Y., Lerner-Lam, A. (2009). Evaluation of a preliminary satellite-based landslide hazard algorithm… NHESS, 9, 673–686. doi:10.5194/nhess-9-673-2009
- Kirschbaum, D. B., Adler, R., Hong, Y., Hill, S., Lerner-Lam, A. (2010). A global landslide catalog for hazard applications. Natural Hazards, 52(3), 561–575. doi:10.1007/s11069-009-9401-4
- Liao, Z., Hong, Y., Wang, J., Fukuoka, H., Sassa, K., Karnawati, D., Fathani, F. (2010). Prototyping an experimental early-warning system for rainfall-induced landslides in Indonesia. Landslides, 7(3), 317–324. doi:10.1007/s10346-010-0219-7
- Liao, Z., Hong, Y., Kirschbaum, D., Adler, R. F., Gourley, J. J., Wooten, R. (2011). Evaluation of TRIGRS… Macon County, NC. Natural Hazards, 58(1), 325–339. doi:10.1007/s11069-010-9670-y
- Kirschbaum, D. B., Adler, R., Hong, Y., Kumar, S., Peters-Lidard, C., Lerner-Lam, A. (2012). Advances in landslide nowcasting… Environ. Earth Sci., 66(6), 1683–1696. doi:10.1007/s12665-011-0990-3
- Liu, C., Li, W., Wu, H., Lu, P., … Hong, Y., Li, R. (2013). Susceptibility evaluation and mapping of China's landslides based on multi-source data. Natural Hazards, 69(3), 1477–1495. doi:10.1007/s11069-013-0759-y
- Zhang, K., Xue, X., Hong, Y., Gourley, J. J., et al. (2016). iCRESTRIGRS: a coupled modeling system for cascading flood–landslide disaster forecasting. Hydrol. Earth Syst. Sci.
References · Act II
Context papers by other groups
- Farahmand, A., AghaKouchak, A. (2013). A satellite-based global landslide model. NHESS, 13, 1259–1267.
- Kirschbaum, D., Stanley, T., Zhou, Y. (2015). Spatial and temporal analysis of a global landslide catalog. Geomorphology.
- Stanley, T., Kirschbaum, D. B. (2017). A heuristic approach to global landslide susceptibility mapping. Natural Hazards, 87.
- Kirschbaum, D., Stanley, T. (2018). Satellite-based assessment of rainfall-triggered landslide hazard for situational awareness. Earth's Future, 6. doi:10.1002/2017EF000715
- Brunetti, M. T., Melillo, M., Peruccacci, S., Ciabatta, L., Brocca, L. (2018). How far are we from the use of satellite rainfall products in landslide forecasting? Remote Sensing of Environment.
- Emberson, R., Kirschbaum, D., Stanley, T. (2021). Global connections between El Niño and landslide impacts. Nature Communications.
- Wang, S., Zhang, K., Chao, L., et al. (2021). Exploring the utility of radar and satellite-sensed precipitation… integrated prediction of flood and landslide hazards. J. Hydrology, 603, 126964.
- Stanley, T., Kirschbaum, D., et al. (2021). Data-driven landslide nowcasting at the global scale (LHASA 2.0). Frontiers in Earth Science.
- Kirschbaum, D., Stanley, T., et al. (2022). Global Landslide Forecasting System for Hazard Assessment and Situational Awareness. Frontiers in Earth Science.
- Kirschbaum, D., et al. (2023). Landslide database sustainability. Sustainability, 15, 3323.
- (2023). Landslide hazard and climate change. Nature Reviews Earth & Environment.
- Li, W., et al. (2024). Landslide research in urban areas. Natural Hazards. doi:10.1007/s11069-024-07064-4
- Vershel, et al. (2025). Open inventories of rainfall-triggered landslides. Geoscience Data Journal.
- Stanley, T., et al. (2025). Landslide hazard is projected to increase across High Mountain Asia. Earth's Future.
- Stanley, T., et al. (2025). Comparing IMERG V06 and V07 for triggering landslides. J. Applied Meteorology & Climatology.
- Wu, X., Chen, X., Zhan, F. B., Hong, S. (2015). Global research trends in landslides during 1991–2014. Landslides, 12, 1215–1226. (note: "Song Hong" — a different author)
Act II papers are included as the lineage of the Act I framework; Yang Hong is not an author on these.
Thank you
Sensing the sky to
watch the ground
Prof. Yang Hong · HyDROS Lab · University of Oklahoma
2006 proof of concept → 2025 operational global forecasting & climate projection